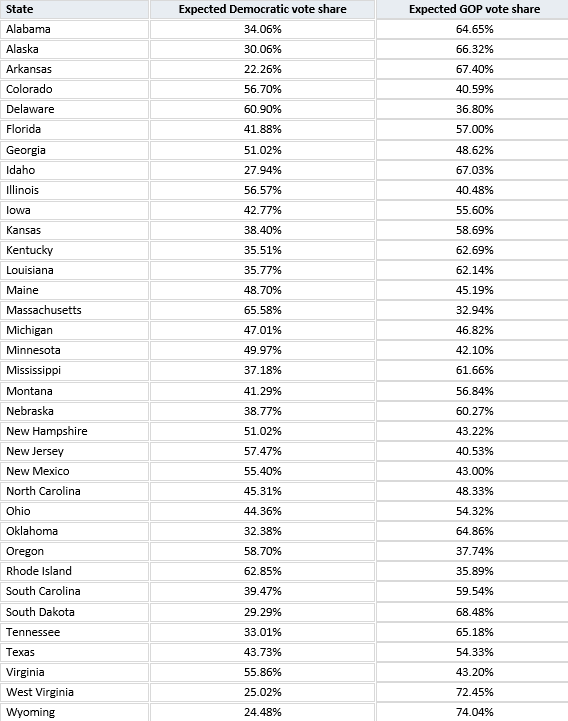
Winning an election and running a strong campaign are not always the same thing. A candidate may win comfortably while performing below what the state’s voting history would suggest. Another may lose while substantially exceeding expectations. Our anticipated results model provides a starting point for making that distinction in the 2026 Senate elections. The purpose of this statistic is to provide context for the typical win or loss analysis of political campaigns.
This analysis follows our PAAR, or Percent Above Anticipated Result model. PAAR compares a candidate’s actual vote share with the share a generic candidate would be expected to receive. Because the 2026 elections take place on November 3, this memo examines the expected results that will serve as the benchmark for evaluating candidate performance.
The central finding is that the competitive Senate races have very different underlying partisan foundations. Michigan is almost evenly divided in our model; meanwhile, several other races the Cook Political Report classifies as toss-ups have substantial theoretical Republican baseline advantages.
THE SOLID STATES
The model favors the same party in all 21 races classified as solid in the Cook Political Report ratings as of October 20, 2026. Nine favor Democrats, and 12 favor Republicans. Mississippi moved from Solid Republican to Likely Republican in the October 20 update.
These races provide the least disagreement between our historical estimates and Cook’s assessment. They will nevertheless remain relevant to the eventual PAAR analysis. A comfortable victory does not automatically establish that a candidate exceeded expectations, just as a loss does not automatically establish that a campaign underperformed.
HOW THE EXPECTED RESULTS ARE CALCULATED
The model averages each party’s performance in two previous Senate elections in each state and the 2020 and 2024 presidential elections. Each election contributes one quarter of the historical baseline. Adjustments account for incumbency, the state’s partisan classification, open seats in swing states, and changes in presidential support among white voters. Each party’s demographic adjustment is its change in white-voter support from 2020 to 2024, divided by four years and multiplied by 0.75. These adjustments are calculated separately for Democrats and Republicans using the workbook’s inputs for all 35 states.
Independent candidates are handled through specific historical proxies. Maine’s 2024 Democratic-side Senate input is Angus King’s 52.1%, rather than Democratic nominee David Costello’s 10.8%; those shares are not added together. In Nebraska, Dan Osborn’s 46.47% in the 2024 regular election substitutes for a Democratic candidate because none ran. These choices feed the four-election average. They do not reclassify either independent as a Democrat or predict how they would caucus.
Appointed senators running to retain their seats are coded as incumbents. The worksheet assigns two years to Jon Husted in Ohio and Ashley Moody in Florida, and one year to Darline Graham in South Carolina, using approximate tenure through January 2027. The incumbency adjustment is one percentage point of party vote share per six years, capped at two points, added to the incumbent party and subtracted from its opponent. Ohio and Florida therefore receive roughly 0.33 points per side, and South Carolina roughly 0.17. The appointee does not inherit the predecessor’s tenure.
These estimates describe expected party vote shares under the PAAR assumptions. They are not probabilities of victory and do not incorporate polling or the current candidates’ campaign performance. PAAR is actual vote share minus expected vote share, measured in percentage points. A candidate receiving 52% against a 48% benchmark earns +4 points; a candidate receiving 42% against that benchmark earns −6 points.
STATES COOK RATES AS TOSS UPS
Cook’s ratings determine which races appear in this section. Toss Up means Cook considers the current contest competitive; it does not mean the PAAR model estimates a zero-point margin. The PAAR column is the difference between the two parties’ expected vote shares using historical results and model adjustments. It is a benchmark for evaluating performance after the election, not a polling margin or a probability of winning.
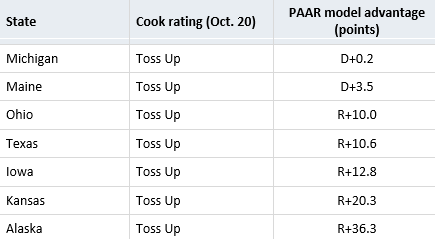
Michigan offers the clearest example of a race where neither party begins with a meaningful advantage. The historical baseline favors Democrats by approximately 0.8 points, but the demographic adjustment reduces that separation to just 0.2 points. Under this model, relatively small departures from expected performance could determine the winner.
Ohio, Texas, and Iowa have PAAR Republican advantages of approximately 10.0, 10.6, and 12.8 points, respectively, while Cook rates all three Toss Up. Cook’s assessment of the current contests is therefore more competitive than these historical benchmarks suggest. A Democratic victory would exceed the model’s expected party ordering. A Republican victory would still need to be compared with that candidate’s expected vote share to assess campaign performance.
Kansas illustrates the largest conventional two-party gap in this section: Cook rates it Toss Up, while PAAR gives Republicans a 20.3-point benchmark advantage. Cook’s classification does not change that model output. If the actual result is close, it would show a substantial departure from the historical model, which PAAR would measure separately for each candidate.
Alaska has the largest PAAR Republican advantage in the section, at 36.3 points, despite Cook’s Toss Up rating. Its historical Republican inputs combine first-choice support for multiple Republican candidates. Those inputs do not represent a conventional contest between one Democrat and one Republican, and the margin should not be read as a forecast of the final ranked-choice result.
STATES COOK RATES AS LEAN OR LIKELY
The Cook rating and PAAR model advantage measure different things. Cook assesses the current contest using factors such as candidates, the political environment, and interviews with campaign professionals. PAAR estimates a historical performance benchmark. These classifications are not assigned by applying margin thresholds to the PAAR results.
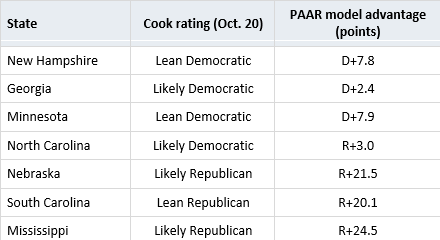
New Hampshire has a recalculated PAAR Democratic advantage of 7.8 points, compared with Georgia’s 2.4 points, yet Cook rates New Hampshire Lean Democratic and Georgia Likely Democratic. The larger PAAR margin does not automatically produce a stronger Cook rating because the two assessments measure different things. Minnesota has a recalculated PAAR Democratic advantage of 7.9 points and is also Lean Democratic following Cook’s October 20 change. Georgia’s narrower benchmark includes a two-point Democratic margin benefit from the incumbency adjustment.
North Carolina is the clearest disagreement over the favored party. The historical model gives Republicans a three-point advantage, while the classification favors Democrats. If Democrats win, the result would reverse the model’s expected party ordering. The size of any candidate’s PAAR score would depend on their actual vote share relative to their individual benchmark.
Nebraska and South Carolina produce recalculated Republican advantages of approximately 21.5 and 20.1 points, respectively. Mississippi, now rated Likely Republican, has an estimated Republican advantage of 24.5 points. These are historical model benchmarks rather than expected winning margins derived from current polling.
Nebraska’s Democratic-side benchmark of 38.77% is a comparison point for the non-Republican side, built partly from Osborn’s 2024 independent vote share and partly from Democratic results in other elections. The resulting Republican advantage of about 21.5 points compares 60.27% with 38.77%. Osborn’s independent coalition may differ from a Democratic nominee’s, so his eventual PAAR score should be described as performance against this proxy benchmark. It should not be interpreted as a direct estimate of Democratic support or a commitment to caucus with Democrats.
IMPLICATIONS
The implications differ for each party. Republicans have several seats where matching their anticipated performance would put them in a strong position to win. Democrats need to protect their narrowest advantages while securing gains in Republican-held territory. Their strongest performances will matter most if they occur in races where additional support changes the winner.
After the election, PAAR will help distinguish candidates who benefited from favorable circumstances from those who exceeded them. A Republican win in a state with a substantial expected Republican advantage may preserve a seat without demonstrating exceptional performance. A Democrat who substantially exceeds expectations in Republican territory may deliver a strong campaign even while falling short. For Senate control, however, the decisive question will be which party turns those stronger performances into additional seats.